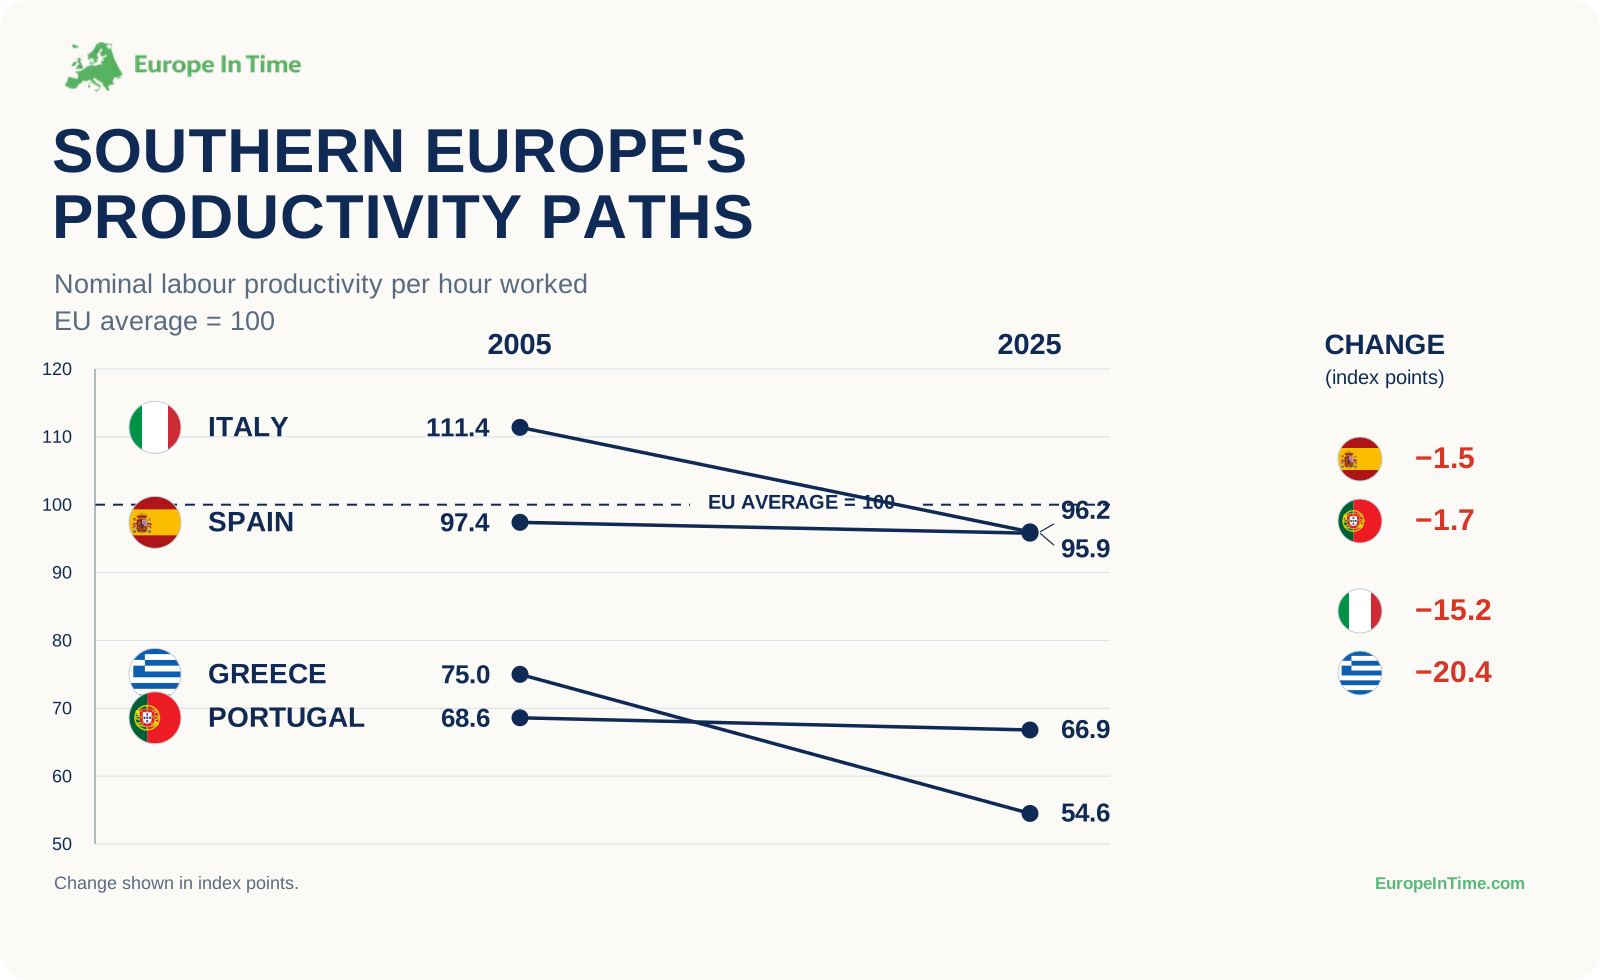
Southern Europe has lost relative ground
The indicator used here measures nominal labour productivity per hour worked relative to the EU average, which is set to 100. A value above 100 therefore means productivity above the EU average in that year, while a value below 100 means productivity below it.
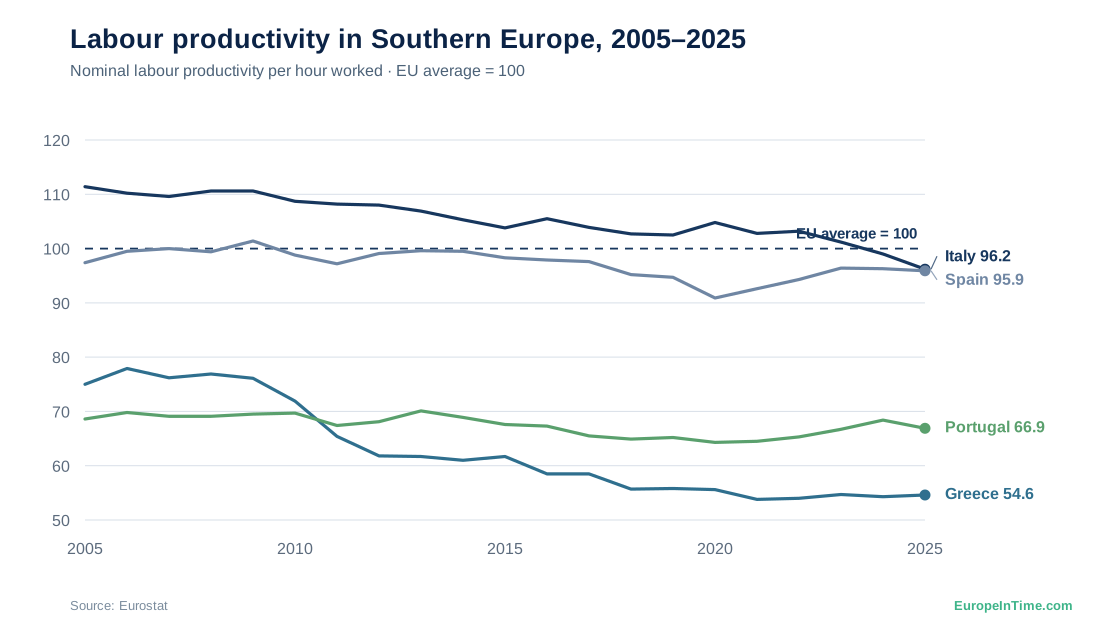
Across the four countries, the trajectories since 2005 have been strikingly different. Greece’s decline was particularly concentrated between 2009 and 2012, when its index fell from 76.1 to 61.8. Italy followed a much more gradual path, remaining above the EU average until 2023 before falling below it in 2024. Portugal, meanwhile, declined steadily after 2013 before recovering some ground from 2021. Spain’s relative position proved considerably more stable over the full period, apart from a marked drop in 2020 followed by a subsequent recovery.
The four countries followed very different paths
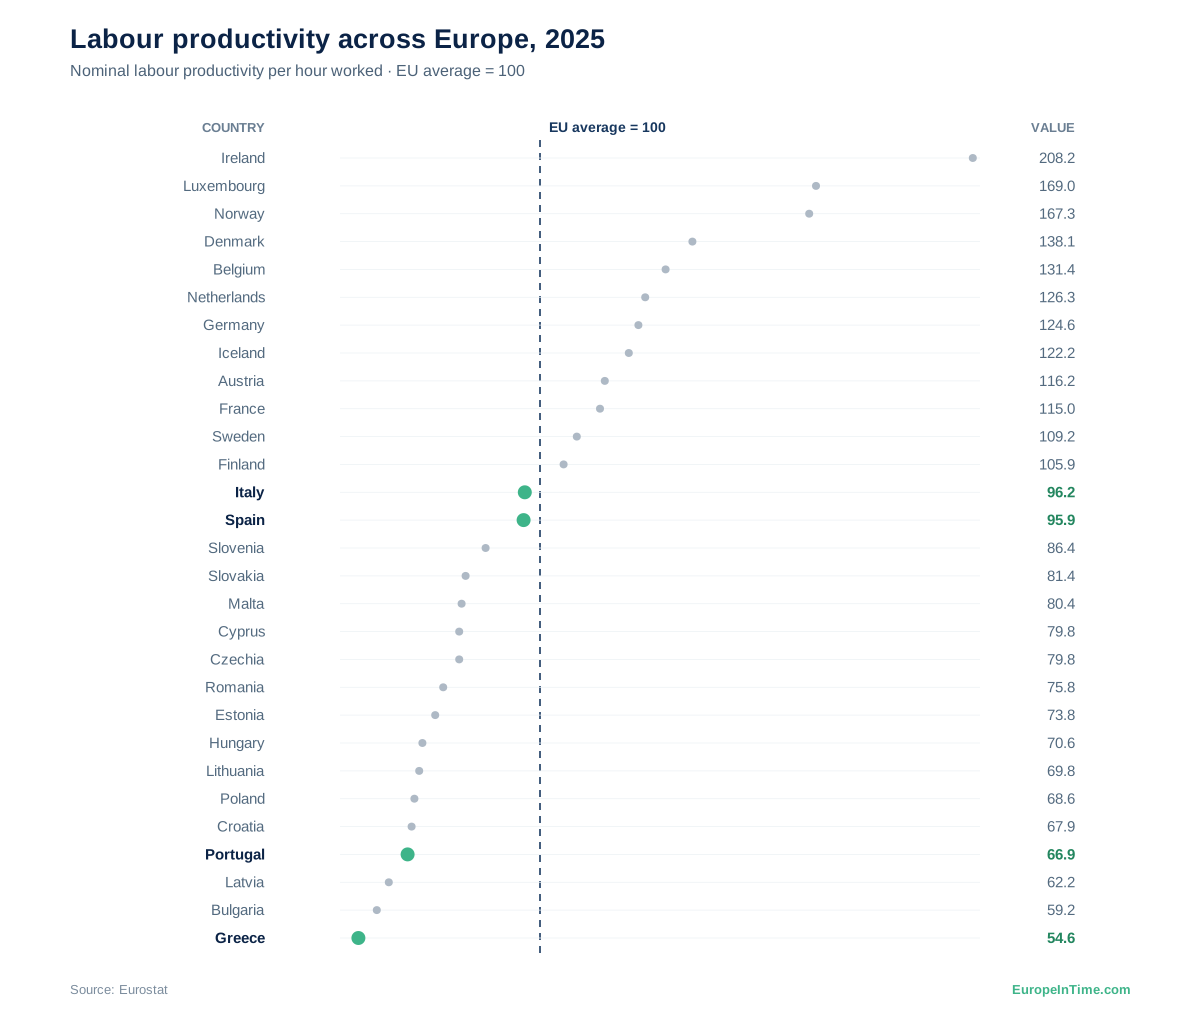
Where did Southern Europe stand in the European comparison in 2025?
The 2025 European comparison reveals substantial differences across the continent. Ireland stands at the top of the ranking with a value of 208.2, followed by Luxembourg (169.0) and Norway (167.3). The top ten consists of countries in Western and Northern Europe, while most countries in Central, Eastern and Southeastern Europe remain below the EU average.
Among the four Southern European countries examined here, Italy and Spain were closest to the EU average in 2025, sitting almost side by side at 96.2 and 95.9. Portugal was considerably lower at 66.9, while Greece, at 54.6, ranked last among the 29 EU and EFTA countries with available data. The comparison therefore highlights how different the four Southern European economies' positions within Europe are today.
Why have the productivity paths diverged?
The Eurostat index shows where each country stands relative to the EU average, but it cannot by itself explain why the paths have diverged. For that, a wider body of evidence is needed. OECD country studies point to a recurring set of structural factors — investment, firm size and dynamism, innovation, technology adoption and skills — but the mix differs from country to country. The OECD evidence discussed below therefore provides context for the patterns in the chart rather than a direct causal decomposition of the Eurostat index.
Italy: a long productivity slowdown
Italy’s slide is not simply a story of uniformly weak companies. The OECD notes that Italian firms compare relatively well with peers of a similar size in other countries, while a comparatively large share of activity remains concentrated in smaller, lower-productivity firms. Many firms struggle to scale up, and weak business dynamism, regulatory burdens and relatively low corporate research and innovation continue to weigh on aggregate productivity. In other words, Italy’s problem is partly about how productive activity is distributed across the economy, not just how well its strongest firms perform.
Greece: the legacy of an investment collapse
Greece’s decline has a different backdrop. According to the OECD, business and public investment collapsed after the sovereign debt crisis, reducing the country’s productive capital stock, while weak total factor productivity growth and limited innovation added to the drag. The structure of the economy matters too: agriculture and tourism, which typically generate lower value added per worker, account for a larger share of activity than in many other EU countries. Yet the OECD also finds sizeable productivity gaps within sectors, suggesting that sector mix alone cannot explain the weakness. Investment has been recovering, but many micro and small firms still face difficulties growing, adopting new technologies and accessing the skills and finance needed to become more productive.
Spain and Portugal: stability does not mean the productivity challenge is solved
Spain and Portugal look much more stable in the Eurostat index, but that should not be mistaken for the absence of structural productivity problems. In Spain, the OECD points to persistent productivity gaps between smaller and larger firms, limited access to finance and skilled workers for many SMEs, and slower adoption of advanced digital technologies outside large companies. There are signs of improvement: Spain has made substantial progress in digitalisation, and the OECD reports a positive performance in hourly labour productivity since 2022. Yet a significant productivity gap with the EU remains.
Portugal presents another useful distinction between level and direction. Its productivity level remains well below the European benchmark in this indicator, yet its relative position changed little between 2005 and 2025. The OECD reports that Portuguese labour productivity growth has accelerated in recent years, driven largely by private services, while long-standing weaknesses remain: investment has been comparatively low and productivity gaps are particularly large among micro and small firms.
What could change the picture?
That makes the next phase especially interesting for Greece and Italy. A domestic recovery in productivity would not necessarily translate into convergence if the rest of Europe advances at a similar pace.
The OECD studies point repeatedly to some of the same levers: stronger productive investment, conditions that allow successful firms to grow, wider adoption of advanced technologies, more innovation and better matching of skills to business needs. These are not forecasts, and there is no guarantee that the four countries will converge. But they provide a useful set of signals to watch as new data arrive.
Southern Europe is not one productivity story
The headline is therefore more nuanced than a simple story of southern Europe falling behind. Greece and Italy have lost substantial ground relative to the EU average since 2005. Spain and Portugal face productivity challenges of their own, but they have not experienced the same deterioration against the benchmark. Geography groups the four countries together; their productivity paths do not.