Insights

Where have house prices risen the most in Europe?

House prices have risen across most of Europe since 2016, but the scale of the increase has varied enormously. Hungary stands out by a wide margin, while a number of other countries have also seen prices more than double.

Quick Insight 3 min read
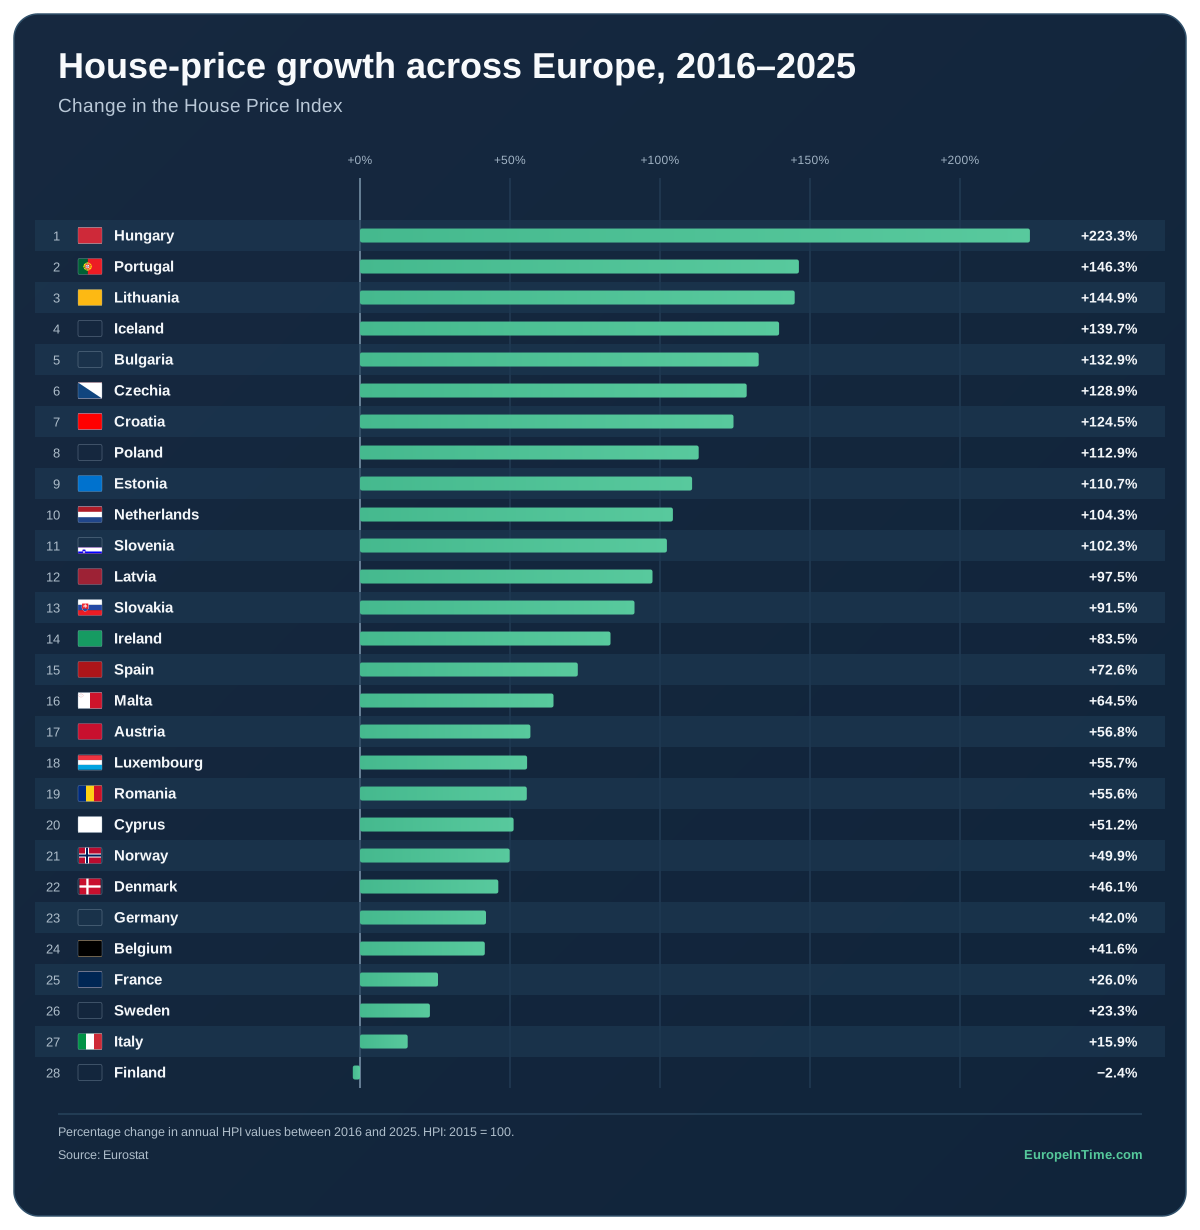
Ranking of house-price growth across 28 European countries between 2016 and 2025. Hungary recorded the largest increase at 223.3%, while Finland was the only country with a slight decline.
28 countries with complete data for both 2016 and 2025 are shown. Download: SVG PNG

A decade of dramatically different house-price growth

House prices have risen across most of Europe over the past decade, but the size of the increase has differed sharply between countries. Hungary stands apart, with its House Price Index increasing by about 223% between 2016 and 2025.

Portugal and Lithuania followed with increases of about 146% and 145%, while Iceland recorded a rise of around 140%. In total, house prices more than doubled in 11 of the 28 countries included in the comparison.

At the other end of the ranking, Italy recorded an increase of about 16%. Finland was the only country in the comparison where the House Price Index was slightly lower in 2025 than in 2016, falling by about 2% over the period.

What the index does — and does not — show

The House Price Index measures how residential property prices change over time. It is designed to compare price developments rather than the absolute cost of buying a home, so a country with faster growth does not necessarily have the most expensive housing in Europe.

Price growth also does not tell us on its own how affordable housing is for households. Affordability depends on factors such as income, mortgage costs, rents and housing tenure. We examine those differences separately in our deeper analysis of house prices and housing affordability across Europe.

About the data

MetricHouse Price Index (2015 = 100)
Comparison2016–2025
Geographic coverageEU + EFTA countries with available data
Countries included28
SourceEurostat
Original dataset Eurostat PRC_HPI_A

The comparison uses annual House Price Index values for 2016 and 2025. Greece, Switzerland and Liechtenstein are excluded because complete data for both comparison years are not available. Percentage changes are calculated from the index values and rounded for presentation.

Share this Quick Insight

Found this comparison useful?

Share it with someone who might find it interesting.

Explore the data

House prices across Europe

Explore how residential property prices have changed across European countries over the full available time series.