Europe’s housing markets have moved in very different directions
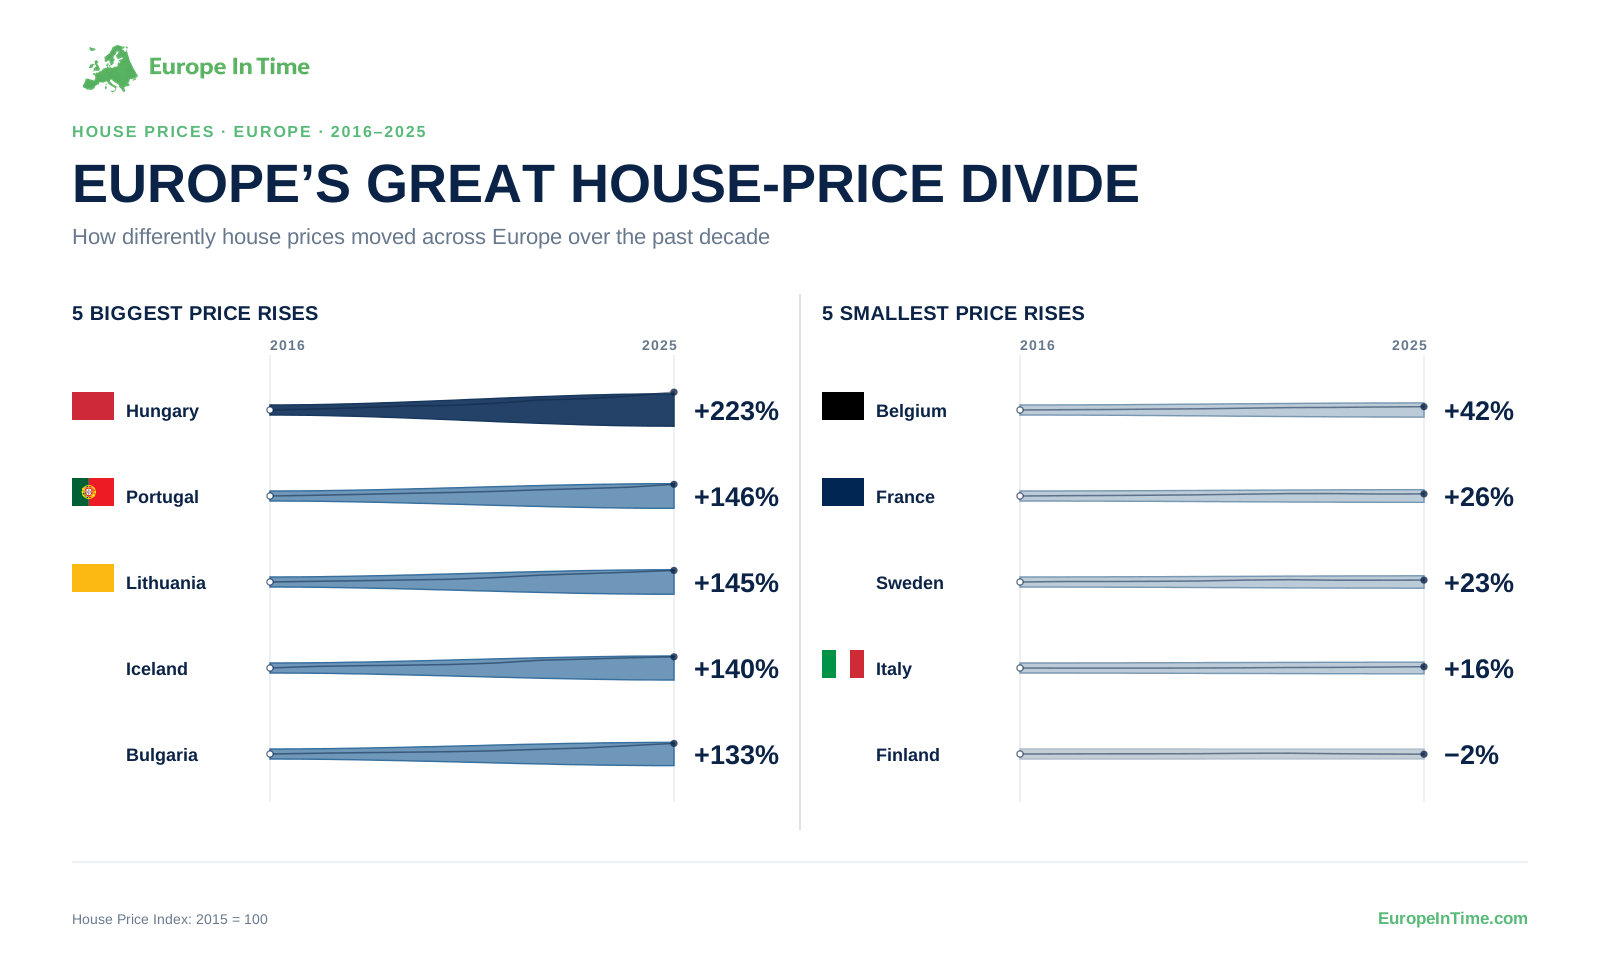
Europe’s housing markets have followed very different paths over the past decade. The House Price Index, which tracks changes in residential property prices with 2015 set to 100, shows just how wide those differences have become.
But rising property prices tell us only part of the affordability story. They do not show directly how much of people’s income goes towards housing, or how that burden differs between households.
Higher house-price growth does not always mean greater housing-cost pressure
Eurostat’s housing-cost overburden rate looks at the issue from a different angle. It measures the share of people living in households where total housing costs, net of housing allowances, exceed 40% of disposable income. Put that measure alongside house-price growth, and the relationship is far from straightforward.

Hungary is the clearest example. Its House Price Index increased by about 223% between 2016 and 2025, yet its housing-cost overburden rate stood at 5.3% in 2025. The Netherlands combined a 104% increase in house prices with an overburden rate of 6.5%, while Ireland recorded an 84% price increase and a 5.3% overburden rate.
Denmark sits in a very different part of the chart. House prices increased by about 46% over the same period — far less than in Hungary — while its housing-cost overburden rate reached 23.4%. Germany stood at 11.2%, while Finland combined almost no house-price growth over the period with an overburden rate of 4.7%.
This does not mean that house prices are unimportant for affordability. It shows something narrower: the relationship is not one-to-one. The two indicators capture different aspects of housing, and the financial pressure households face depends on more than property prices alone.
Where is housing-cost pressure highest?
Looking at housing-cost pressure on its own makes another feature of the data stand out. In 2025, Greece had the highest housing-cost overburden rate in our dataset, at 26.4%, followed by Denmark at 23.4%. Both were far above the next-highest countries: Norway at 13.5%, Germany at 11.2% and Sweden at 10.8%.
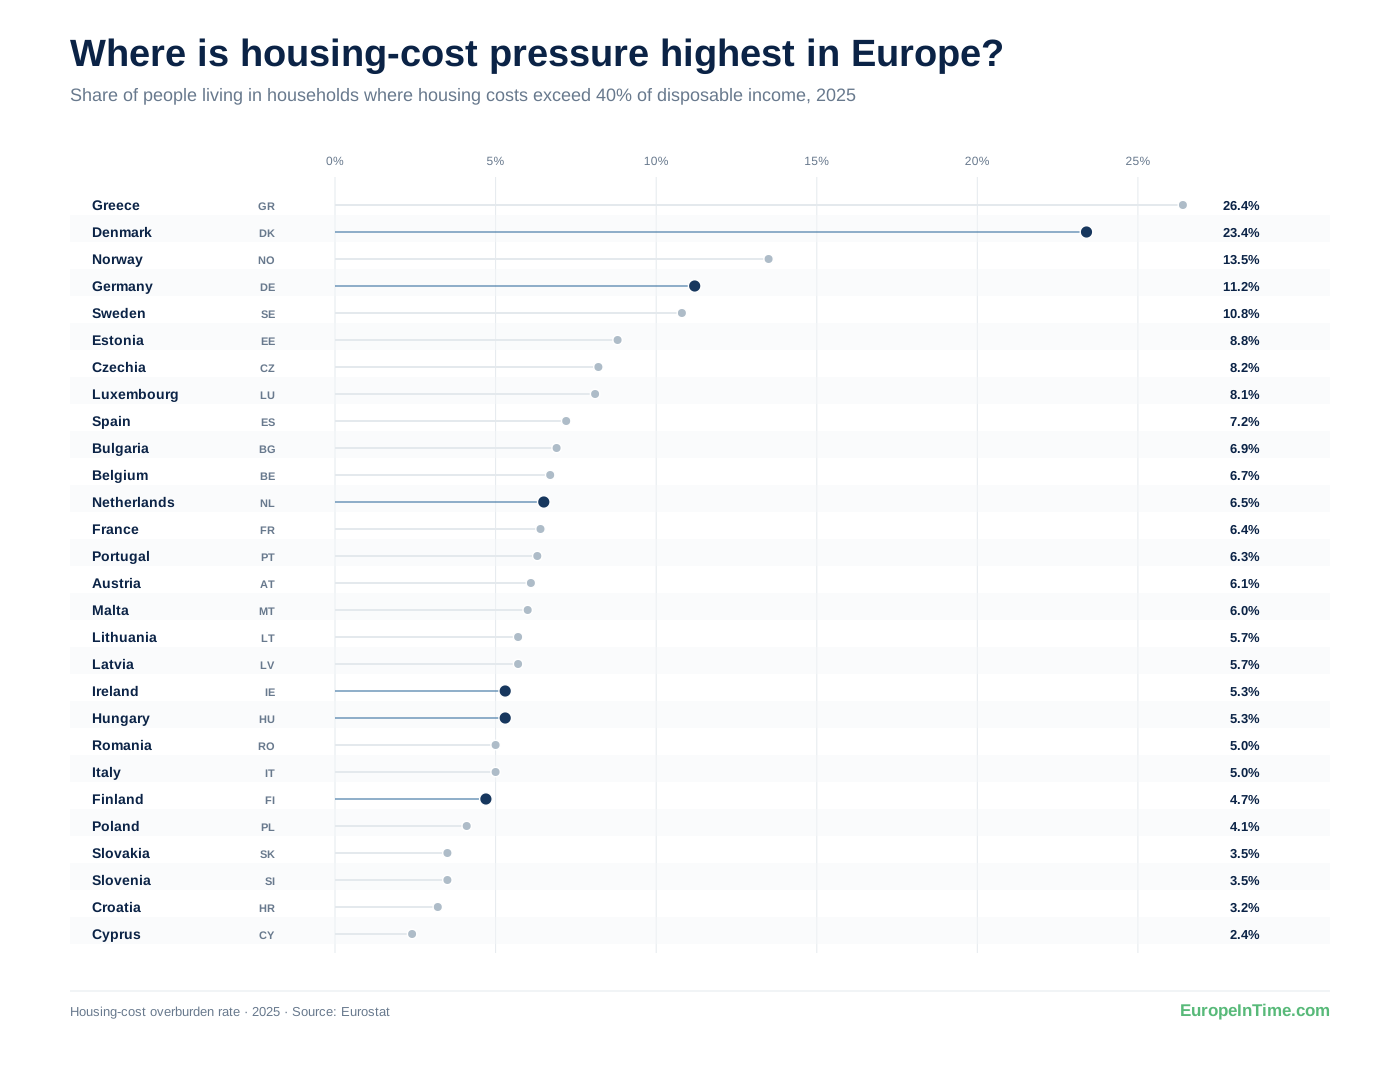
The ranking also reinforces the message from the scatterplot. The countries at the top are not the same as those that experienced the fastest house-price growth over the previous decade. But the ranking should not be read as a complete measure of where housing is or is not affordable.
Why can the two indicators tell different stories?
The answer starts with a simple point: households do not all experience the housing market in the same way. Some own their homes outright, some are paying a mortgage and others rent. Their incomes differ, as do interest rates, rents, housing benefits and the policies that shape national housing markets.
Who owns and who rents?
One important difference is tenure. OECD data show large differences in how Europeans occupy their homes. In several Central and Eastern European countries, including Hungary, a large majority of households own their homes outright. Germany, by contrast, has one of Europe’s largest rental sectors, while renting is also relatively common in countries such as Denmark, Austria and the Netherlands.
That matters because a rise in property prices does not affect an outright owner, a household taking out a new mortgage and a private renter in the same way. A higher market value may make buying a home more difficult for prospective buyers without immediately increasing the monthly housing costs of someone who already owns their home without a mortgage.
Monthly costs depend on more than the price of the home
Financing adds another layer. An ECB analysis covering eleven large euro-area countries found that housing costs developed differently for outright owners, mortgagors and renters between July 2022 and January 2024. Costs rose by around 6% for outright owners, 12% for mortgagors and 9% for renters. For mortgage holders, higher interest payments were an important part of the increase.
These figures do not explain the country differences in our Eurostat chart directly — the ECB analysis covers a different period and a subset of euro-area countries. They illustrate why households can experience housing costs differently even when they live through the same broader property-market cycle.
Income can change the picture again
Affordability also depends on what happens to household income. If housing costs rise while incomes rise as well, the resulting burden can look very different from a situation in which housing costs increase and incomes stagnate. The ECB found that nominal income growth largely offset higher housing costs over the period it studied, leaving the overall housing-cost-to-income ratio broadly stable.
This is also why researchers use broader measures of affordability. A Bank for International Settlements study argues that simple price-to-income ratios miss important financing conditions. Its cross-country affordability measure incorporates not only house prices and household income, but also mortgage rates, loan-to-value ratios and mortgage maturities.
In other words, two households facing the same property price can experience very different affordability depending on their income and the terms on which the home is financed.
Housing policy can change who bears the pressure
Housing policy can further change the picture. Social housing, housing allowances, rent regulation and other forms of support affect the costs faced by particular groups of households. OECD comparisons show especially large differences in housing burdens between low-income private renters, subsidised renters and homeowners.
The Netherlands shows why the overburden rate should not be treated as a complete verdict on housing affordability. House prices in our data rose by about 104% between 2016 and 2025, while the housing-cost overburden rate stood at 6.5% in 2025. Yet the OECD’s 2025 Economic Survey of the Netherlands describes housing affordability as a key challenge, pointing to persistent housing shortages and imbalances across the owner-occupied, social-rental and private-rental sectors.
There is no contradiction here. The overburden rate asks a specific question: what share of people currently live in households whose housing costs exceed 40% of disposable income? It does not tell us how difficult it is for a first-time buyer to enter the market, whether enough homes are available, or how expensive a typical home has become relative to income.
House prices are important — but they are only part of the picture
So, are rising house prices making housing less affordable across Europe? They can certainly add to affordability pressures — particularly for people trying to buy a home — but price growth alone cannot tell us how much pressure households are actually under.
Across Europe, the picture depends on much more: incomes, rents, mortgage costs, whether households own or rent, and the policies that shape national housing markets. Hungary shows how dramatically property prices can rise without appearing near the top of the housing-cost overburden ranking. Greece and Denmark show the other side of the story: the highest current housing-cost pressure in our dataset is not found in the countries with the fastest decade-long price growth. To understand housing affordability, house prices need context.